
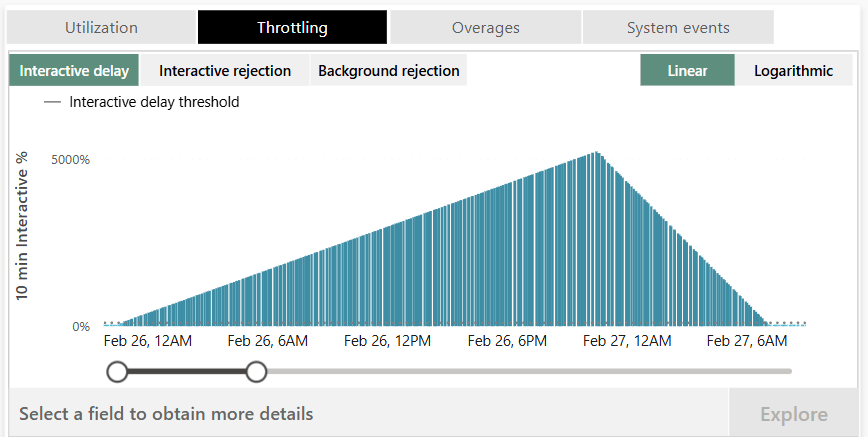
Why is my Fabric Data Pipeline CU usage so high?
Picture this, you have a 100 small CSV files to load into your Fabric Warehouse and need as you want to do it quickly you setup a Data Factory pipeline. You give it a quick run through to test it and see that it runs fast, with each copy taking around 10 seconds for a full duration of around 40 seconds due to the loop being in parallel. Based on a quick read of the pipeline pricing model page you expect the total CU cost of this run to be

The hidden cost of dataflows Gen 2 and the on-prem gateway
One of the common comments about Dataflows Gen 2 is that the CU cost can be much higher than a similar Gen 1 dataflow. While they do have the same name, they do work quite differently under the hood and different technologies tend to have different costs, there is one key difference between the two in how they are billed.
In dataflows Gen 2 the pricing is relatively simple with the Microsoft documentation stating you are charged per second of the dataflow runtime (I’m over simplifying here, staging and fast copy can complicate this a bit). In dataflows Gen 1 the billing even simpler as it is just the compute time taken by the refresh.
How to fix Power Query unknown identifier error
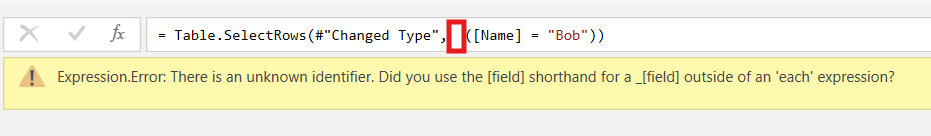
If you have had the following error in Power Query it can be quite annoying to work out what is causing it
Expression.Error: There is an unknown identifier. Did you use the [field] shorthand for a _[field] outside of an 'each' expression?
Normally this error is caused because an each keyword was accidentally deleted from a filter or new column.
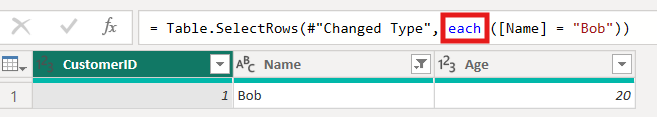
Normal correct function
Erroneous function

So to fix this you need to open the advanced editor and check the Power Query code is not missing an each.
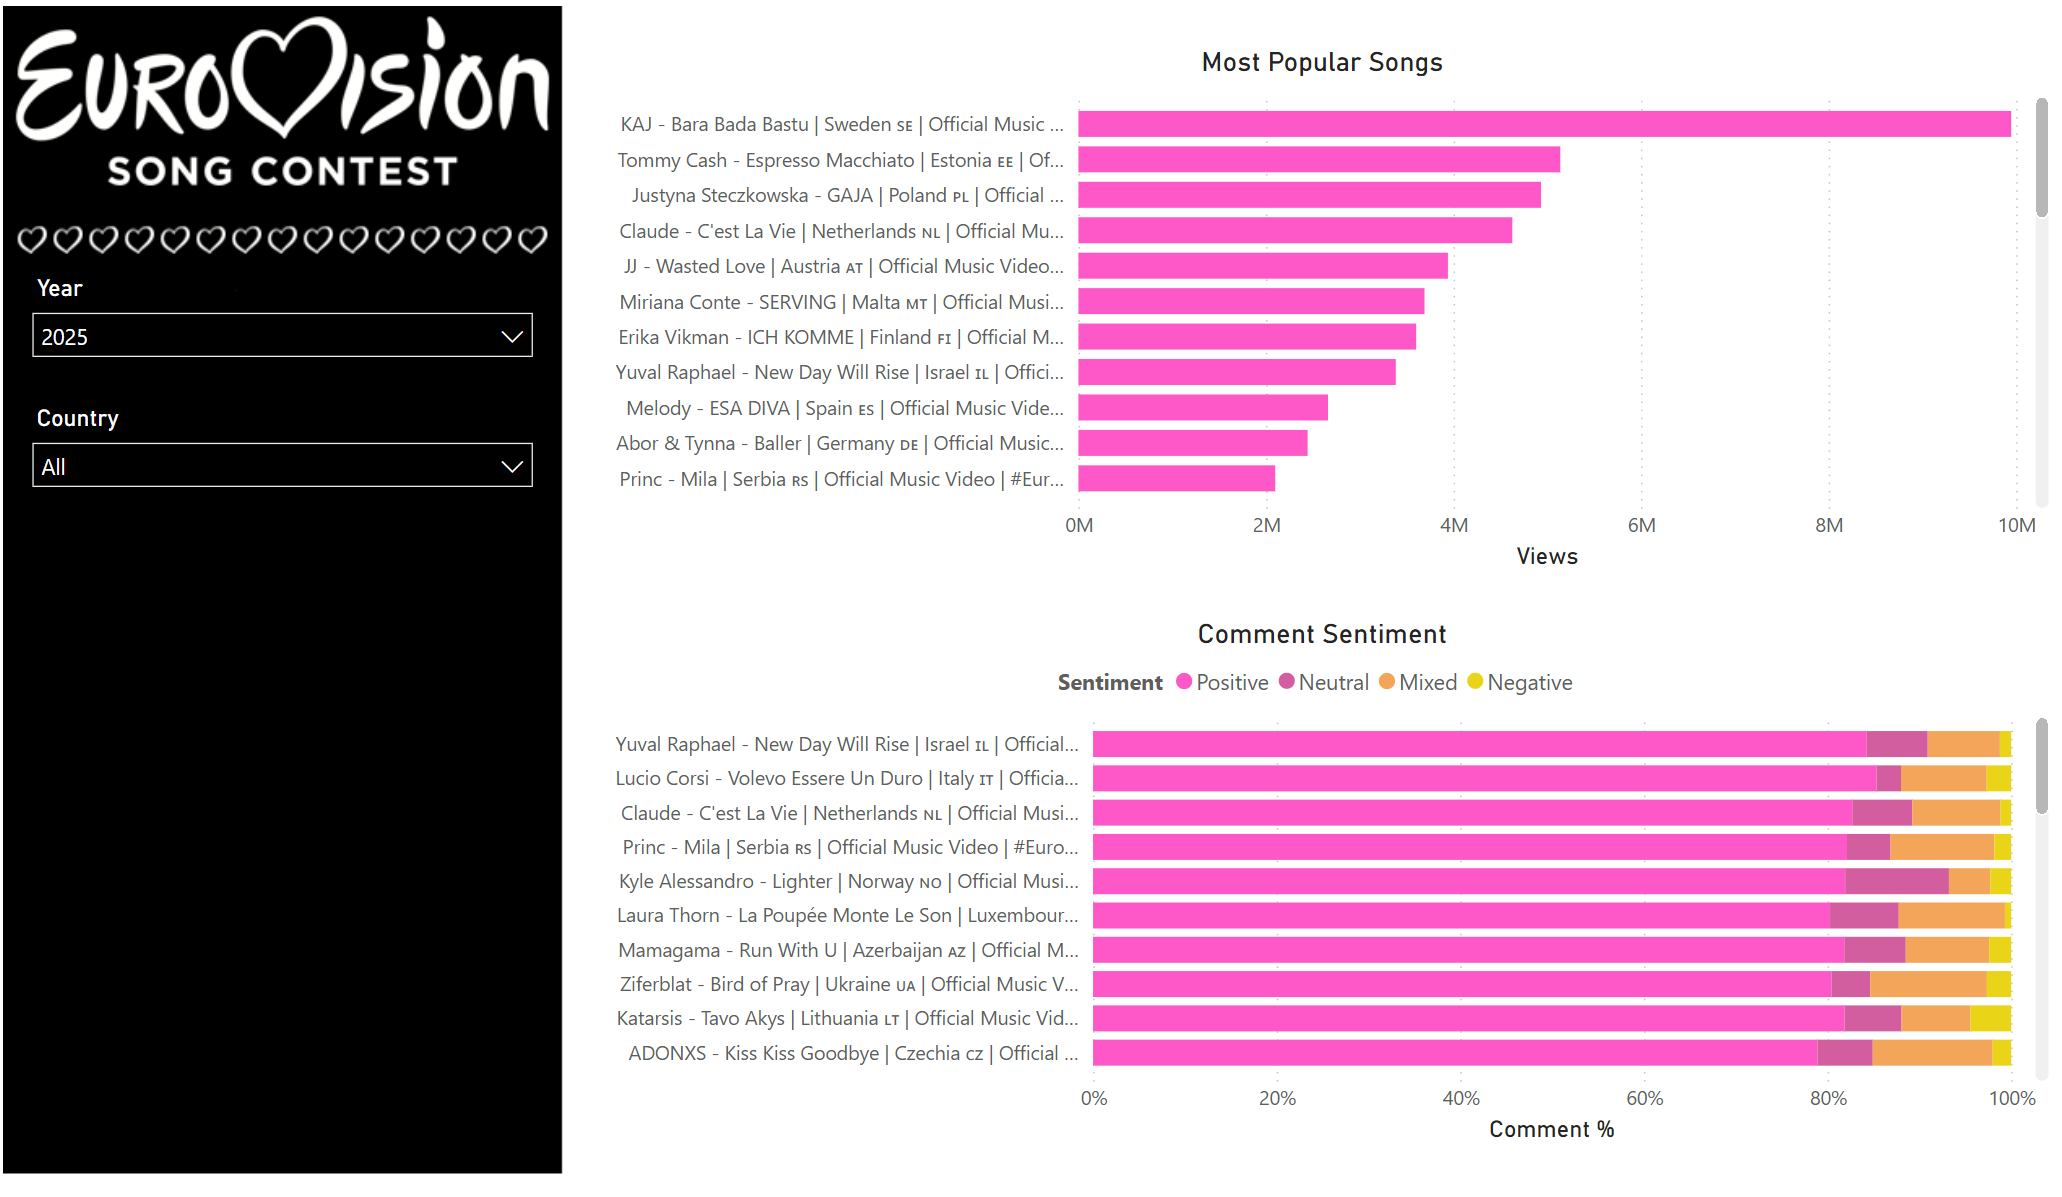
Eurovision with Fabric: Part 3
This is the final post of the mini series on Eurovision analysis. If you haven’t read part one or part two I would recommend you read them first.
Orchestration
Before we cover the reporting and analysis, I thought it worth briefly covering how all the notebooks are orchestrated. To control notebook orchestration there are a few different options within Fabric, runMultiple with a DAG, Airflow, or a data pipeline.
There are a few pros and cons for each option, such as cost, easy of setup, etc. For this simple project I went for a data pipeline as it was the easiest to quickly setup. As for the pipeline itself it consists of a few notebook activities linked with dependencies.
Eurovision with Fabric: Part 2
This is part of a mini series on analysing Eurovision data with Microsoft Fabric. If you missed part one you can read it here. In part 1 I briefly covered the initial data load via the Youtube API and web scraping. So now we need to enhance this data to be ready for final analysis.
Mapping videos to countries
In the initial load of the videos table, the title for the video was returned by the API. However, in order to do meaningful analysis later we need to extract the country of the video. After a few attempts at working out a dynamic way to do this, such as going of flag emojis. However, due to the wide range of variations of title I eventually settled on just having a list of regex with one value for each country that has competed in Eurovision.