Dealing with two level column headers in Power BI
- 3 minutes read - 538 wordsMost of the time tables only have one header, however when there are more than one it can be a challenge to transform it into a useful form.
For this example I’ve created a table that contains made up actuals and budgets broken out by date. This is not an easy format to work with, we need to get it into a tidy unpivoted format that is easy to analyze.
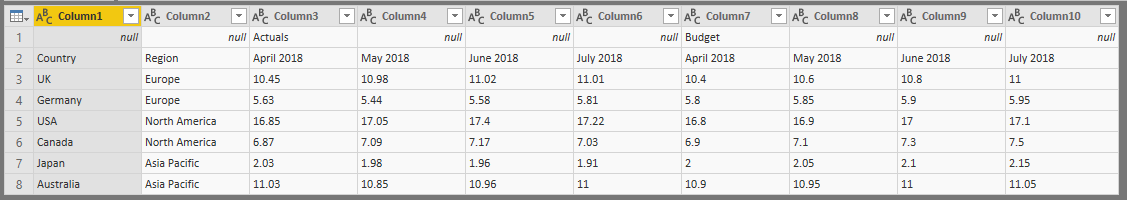
Our data with two header rows
The first step is to transpose the table, aka flipping the columns to rows and the rows to columns. Then we need to combine the header columns together. For the delimiter I would recommend a character that is not present in your data set “^” is often a good option.
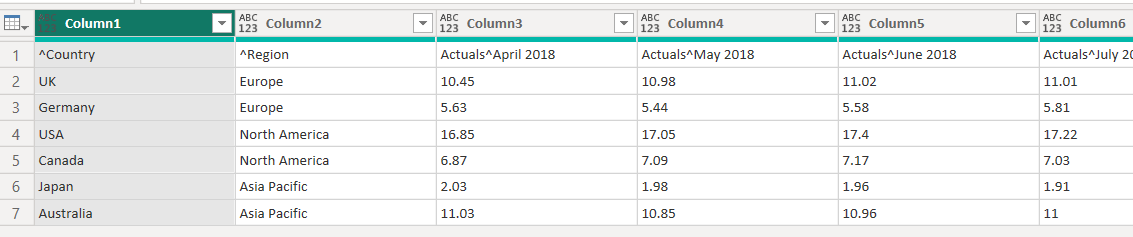
The two headers combined
After that transpose the table again. This has now combined the two header rows, we have already improved this data however we can do better. If we then unpivot any date columns (or any columns that contain the same kind of data). We can then split the attribute column by that delimiter to be able to easily filter by both the first and second headers. These steps will result in a table like the one below
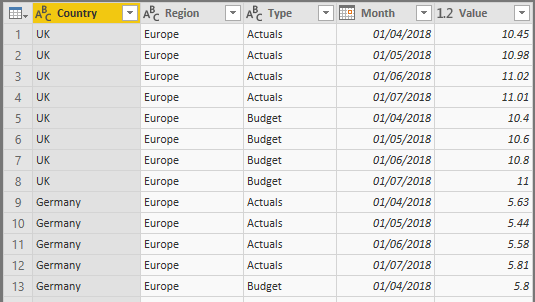
Final result
It is now a lot easier to plot and visualize this data and it will also deal with new columns being added as months go by far better than a wide table would. Transforming tables into long and narrow forms is a very common transformation that goes under different names, such as 3rd normal form or tidy data. It isn’t always better than wide tables but in general I would recommend always starting by going to a narrow table and if that doesn’t work then looking into using wide forms.
The full power query code to do this is below if you want to take a closer look. I hope you find this useful, I have used it many times.
let
    Source = Table.FromRows(
        {
            { null, null, "Actuals", null, null, null, "Budget", null, null, null },
            { "Country", "Region", "April 2018", "May 2018", "June 2018", "July 2018", "April 2018", "May 2018", "June 2018", "July 2018" },
            { "UK", "Europe", 10.45, 10.98, 11.02, 11.01, 10.40, 10.60, 10.80, 11.00 },
            { "Germany","Europe", 5.63, 5.44, 5.58, 5.81, 5.80, 5.85, 5.90, 5.95 },
            { "USA", "North America", 16.85, 17.05, 17.40, 17.22, 16.80, 16.90, 17.00, 17.10 },
            { "Canada", "North America", 6.87, 7.09, 7.17, 7.03, 6.90, 7.10, 7.30, 7.50 },
            { "Japan", "Asia Pacific", 2.03, 1.98, 1.96, 1.91, 2.00, 2.05, 2.10, 2.15 },
            { "Australia", "Asia Pacific", 11.03, 10.85, 10.96, 11.00, 10.90, 10.95, 11.00, 11.05 }
        }
    ),
    Changed_Type = Table.TransformColumnTypes(
        Source,
            {
                {"Column1", type text},
                {"Column2", type text},
                {"Column3", type text},
                {"Column4", type text},
                {"Column5", type text},
                {"Column6", type text},
                {"Column7", type text},
                {"Column8", type text},
                {"Column9", type text},
                {"Column10", type text}
            }
    ),
    Transposed_Table = Table.Transpose(Changed_Type),
    Filled_Down = Table.FillDown(Transposed_Table,{"Column1"}),
    Merged_Headers = Table.CombineColumns(Filled_Down,{"Column1", "Column2"},Combiner.CombineTextByDelimiter("^", QuoteStyle.None),"Headers"),
    Transposed_Table1 = Table.Transpose(Merged_Headers),
    Promoted_Headers = Table.PromoteHeaders(Transposed_Table1, [PromoteAllScalars=true]),
    Unpivoted_Other_Columns = Table.UnpivotOtherColumns(Promoted_Headers, {"^Country", "^Region"}, "Header", "Value"),
    Split_Header_by_Delimiter = Table.SplitColumn(Unpivoted_Other_Columns, "Header", Splitter.SplitTextByEachDelimiter({"^"}, QuoteStyle.Csv, false), {"Type", "Month"}),
    Transform_Column_Names = Table.TransformColumnNames(Split_Header_by_Delimiter, each Text.Replace(_, "^","")),
    Changed_Type1 = Table.TransformColumnTypes(Transform_Column_Names,{{"Country", type text}, {"Region", type text}, {"Type", type text}, {"Month", type date}, {"Value", type number}})
in
    Changed_Type1