Eurovision with Fabric: Part 1
- 4 minutes read - 760 wordsWith Eurovision 2025 only a few weeks away I thought it was time for me to finish some experimenting I had started last year around looking into bringing Eurovision data into Fabric. See what insights we can gain, and maybe if we can predict the winner!
The Plan
As with any event like Eurovision there is a wide range of possible data sources, in order to get a mix of data I decided to start with comparing data from the official music videos on Youtube with the results of the previous contests. This included both simple statistics such as views and likes on each video but also the sentiment on a sample of the comments using some of the AI functions built into Fabric.
So the first task is to load this data into Fabric using the Youtube API and web scraping (this post), enhancing the comment data with sentiment analysis (part 2), and then finally visualising the data and making predictions!
Of course all the code used for this will be in a public github repo
Loading in the data
To load the comments of the videos the easiest way is via the youtube API and its corresponding python package. After some brief setup in the google cloud console I got an API key and am ready to go.
The first layer data that is loaded into the lakehouse doesn’t actually use the API key, it is instead just a list of playlist ids, with one playlist for each year. These are created as a dataframe and then saved as a delta table in the lakehouse. (All code will be uploaded onto GitHub but this notebook is so short I’ve included it below)
data = [
    (2025, "PLmWYEDTNOGUJG7RV2ARlG2OCpq8oNwz2s"),
    (2024, "PLmWYEDTNOGULUJYEhh-EUa32rEcHuNXO7"),
    (2023, "PLmWYEDTNOGUIr757MlL8s9iyvYx-0lToh"),
    (2022, "PLmWYEDTNOGULG6eg0zgzvRercwqRP6mII"),
    (2021, "PLmWYEDTNOGUIFKZpE5Z2uOA5i48KVfqju"),
    (2020, "PLmWYEDTNOGUL69D2wj9m2onBKV2s3uT5Y")
]
With these playlist ids we can now start using the Youtube API. The first API calls are to get the videos of each playlist. The Google Python Client is very straight forward in how we make such a request. Below is a simplified version of the code to load the videos from a playlist.
youtube_client = build_youtube_client(API_SERVICE_NAME,API_VERSION,DEVELOPER_KEY)

request = youtube_client.playlistItems().list(
    part="snippet,contentDetails,status",
    maxResults=50,
    playlistId=playlist_id
)
response = request.execute()
items = response.get('items', [])
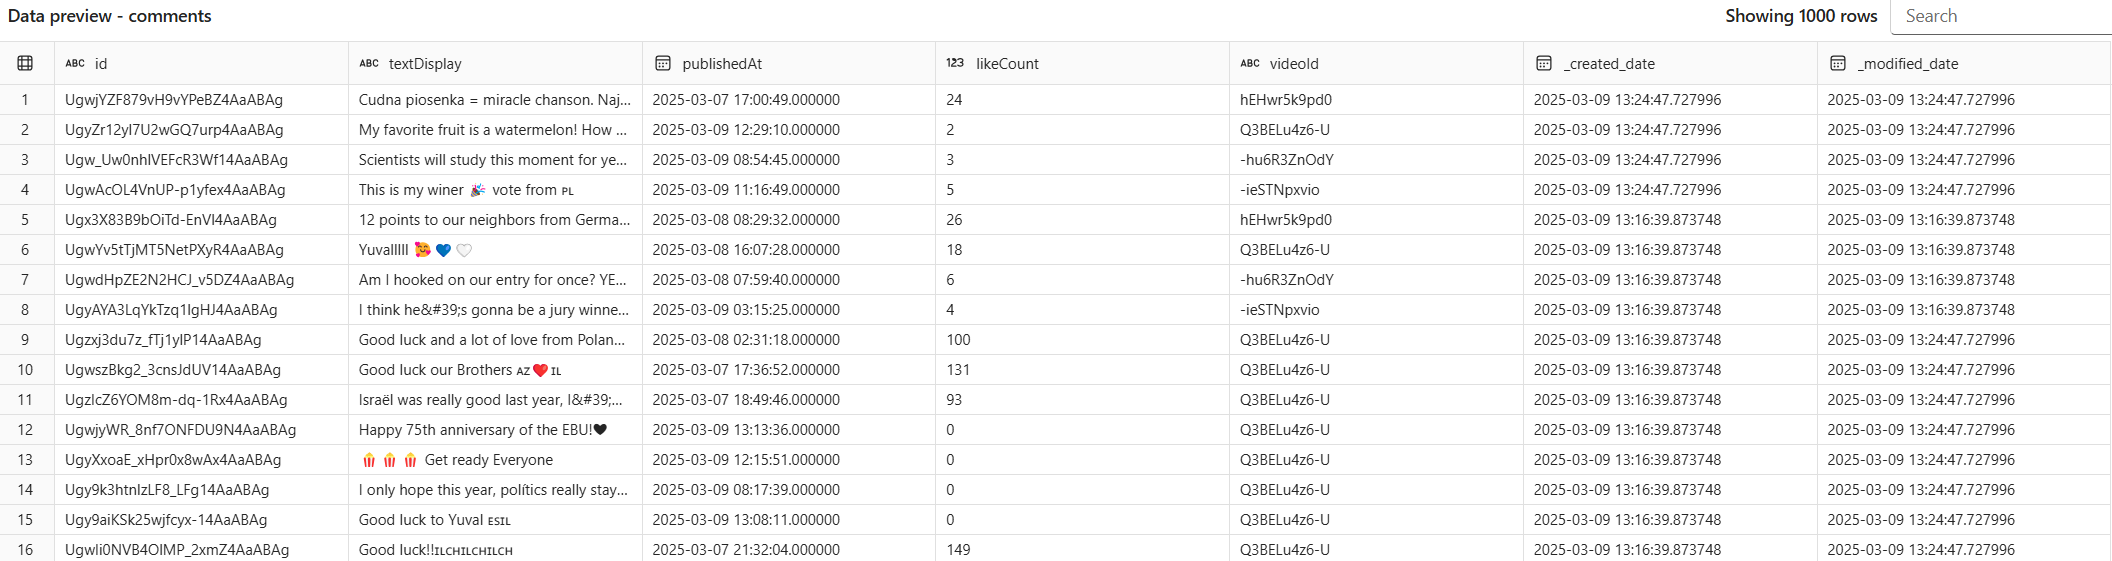
Once all the videos are then loaded we can load in a selection of the comments. However, loading the comments does have some additional complexity compared to the videos. Most of this complexity comes from the much larger volume of data when compared to the list of videos. While a playlist may have 50 or so videos, a video can have tens of thousands of comments or more. This is far more than one API request can handle so we have to batch up the requests and send multiple requests for one video. My aim was to get up to 10,000 comments per video so as the API has a maximum number of comments per request of 100 this could mean up to 100 requests per video. Which could mean up to 19,600 API requests in total!
After running these notebooks we have the views, comments, likes for every video within those playlists. Which will be the foundation for the rest of these posts, it isn’t a complete dataset as often music videos are posted in multiple places, such as the artists/labels channel and these can have a significant amount of views. However, this would have been much harder to identify so I decided to skip these for now.
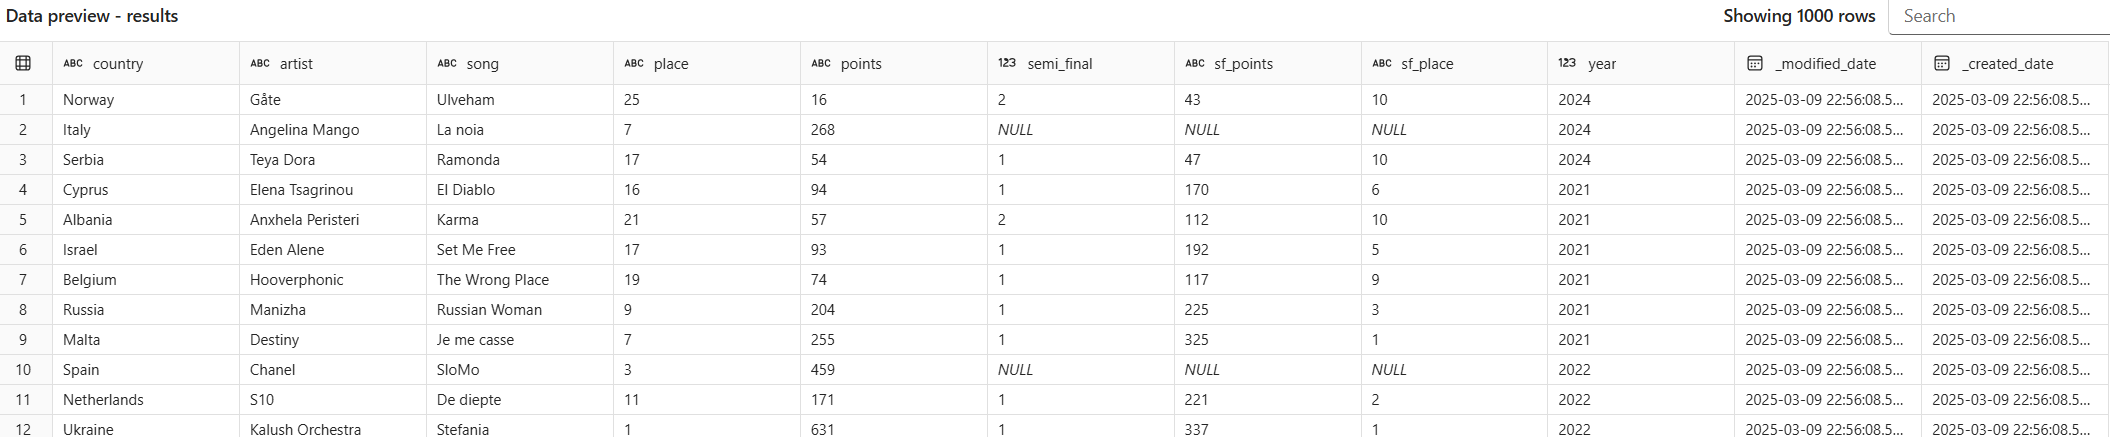
Previous Results
The final dataset to load in is the results of previous years. Unfortunately there is no nice API that gives you Eurovision results, which meant the only option was scraping the Wikipedia pages for each year using a python library called BeautifulSoup. However, even with BeautifulSoup quite a pit of fiddling around was needed as despite the pages for each year all looking the same the HTML was slightly different meaning the code to do all of this was more complex than when I started.
You can access the code on my github for anyone curious! If you want to reuse this code make sure you run these notebooks with a custom environment with the google API python module installed.
Next steps
Now we have all the data loaded into a lakehouse the next steps are to enhance the data such as ranking results, using the synapse machine learning models to do sentiment analysis and then finally visualise the results. You can read the next part of this mini series here.
Cover image by Arkland via Wikimedia Commons