Eurovision with Fabric: Part 3
- 2 minutes read - 293 wordsThis is the final post of the mini series on Eurovision analysis. If you haven’t read part one or part two I would recommend you read them first.
Orchestration
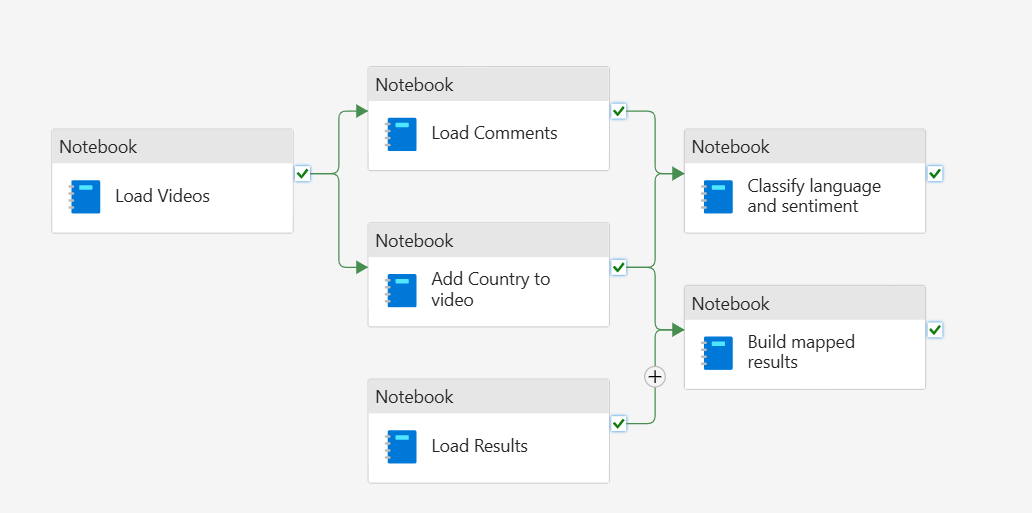
Before we cover the reporting and analysis, I thought it worth briefly covering how all the notebooks are orchestrated. To control notebook orchestration there are a few different options within Fabric, runMultiple with a DAG, Airflow, or a data pipeline.
There are a few pros and cons for each option, such as cost, easy of setup, etc. For this simple project I went for a data pipeline as it was the easiest to quickly setup. As for the pipeline itself it consists of a few notebook activities linked with dependencies.
Reporting & Analysis
For the reporting I wanted to focus on trying to predict the upcoming 2025 event. So I created two pages, one that shows an overview of all the metrics for all the years and then a trends page showing the metrics for the upcoming events. I picked views, likes, comments, and NPS. However, NPS did not prove to have a strong predictive power so it is not included.
Based on these four metrics the predictions are drum roll
| Country | Artist | Views Prediction | Likes Prediction | Comments Prediction | Overall Prediction |
|---|---|---|---|---|---|
| Sweden | Kaj | 1st | 1st | 1st | 1st |
| Poland | Justyna Stezczkowska | 3rd | 6th | 2nd | 2nd |
| Estonia | Tommy Cash | 2nd | 3rd | 8th | 3rd (Joint) |
| Israel | Yuval Raphael | 8th | 2nd | 3rd | 3rd (Joint) |
| Austria | JJ | 5th | 4th | 5th | 5th |
| Netherlands | Claude | 4th | 7th | 4th | 6th |
In a weeks time we shall see if this fun experiment comes through, although I enjoyed creating it and hopefully this mini series was interesting to read as well!
I’ve embedded the report below if you want to have a further look.